2020 Eureka Consumer Price Index Update
The Eureka Consumer Price Index (CPI) is a tool created by the Cal Poly Humboldt Economics Department to show changes in prices for major consumer goods in Humboldt County.
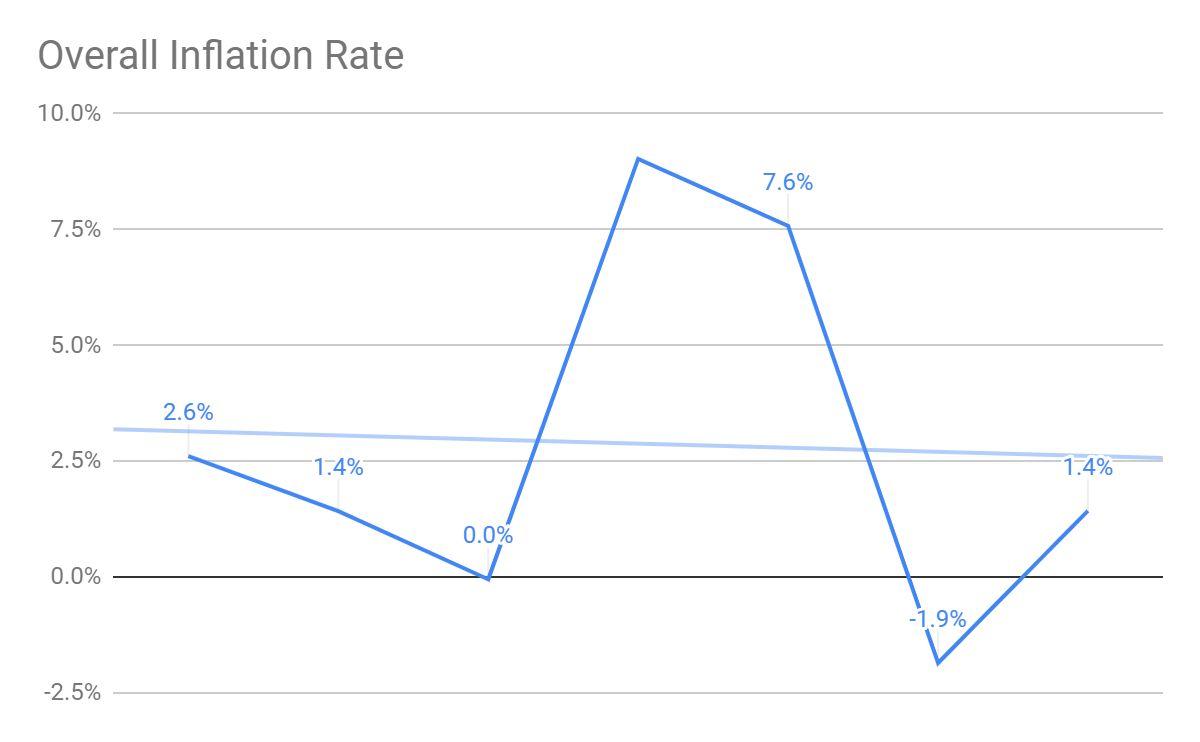
This year Eureka saw an overall inflation rate of 1.4%.
Notable sectors which saw heavy price increases were the food and beverage category at 4.6% and transportation at 11.6%. Food and beverages saw a general increase in prices across its subcategories, such as grains and cereal products to beef and veal. Transportation saw such a large increase in its overall inflation rate due to the price spike of motor vehicle insurance. Geico saw an increase from $385.58 in 2019 to $552.38 in 2020.Other insurance companies showed similar results, with AAA’s price almost doubling, from $551.4 in 2019 to $919 in 2020. Surprisingly, this offset the decrease in both gas and diesel prices, which both lost at least 50 cents per gallon.
Education and Communication experienced a small increase of 2.4%, primarily due to increased tuition fees from Cal Poly Humboldt. Tuition increased by $189 between 2019 and 2020. Shipping rates through Fedex and USPS stayed around the same price, with some small increases or decreases depending on the shipping container.
A large decrease of 12% occurred in the Other Goods and Services .This is primarily because of a decrease in the price of haircuts from Mastercuts, from a price of $25 in 2019 to $20.50 in 2020. Tobacco products and personal care products generally showed stable prices between the years.
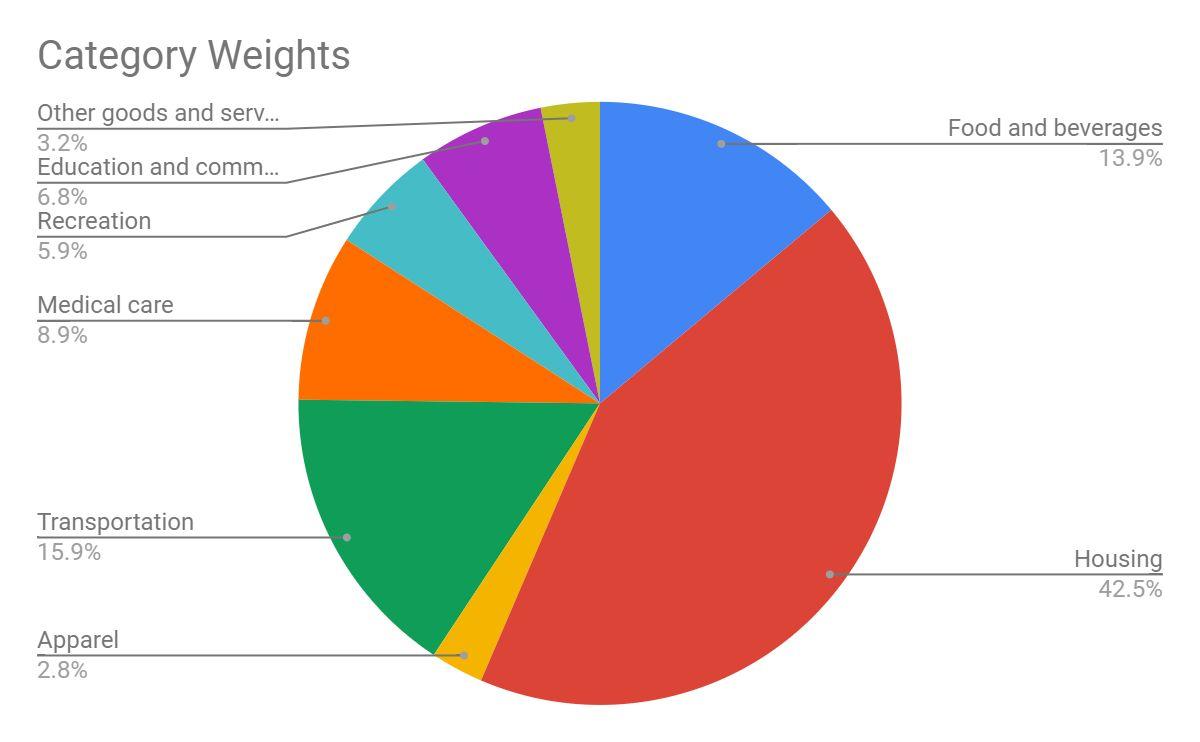
The largest category in the Index is Housing, which makes up 42% of the consumer basket. Yet, this category only saw a 0.5% increase in prices. This is primarily due to stable housing prices, with a small increase in the price of electricity and gas through PG&E. This marginal increase in the largest category weight helps show why the inflation rate is only at 1.4%, even though there are large increases in the food and beverage and transportation sectors. To better understand the impact on purchasing power, we also found wage data through the Bureau of Labor Statistics website and craiglists ads. While the average inflation rate was 1.4%, the average annual salary increased by 2.65%, meaning that average real wages increased by 1.25%. We noticed that almost all of the jobs in our data increased in wages except for the job of assistant professor, which saw an overall decrease.
Overall, the prices in Eureka were stable with relatively small changes in most market baskets except for beverage and transportation, which are extremely volatile markets especially with the current circumstances. See graphs below.