CPI News Release 2021
Press Release: 2021 Eureka CPI Results
May 15, 2021
The Eureka Consumer Price Index (CPI) is a tool created by students in the Cal Poly Humboldt Economics Department to show changes in prices for consumer goods in Humboldt County. We use similar methods and categories that the US Bureau of Labor Statistics (BLS) uses to form the national CPI and calculate the national inflation rate. However, this local project collects far fewer prices than the BLS collects, and as a result, our inflation rate is more volatile. Still, the BLS does not report a CPI for Humboldt County, and we are aware of no other publicly available effort to track the inflation rate of the County besides this Eureka CPI.
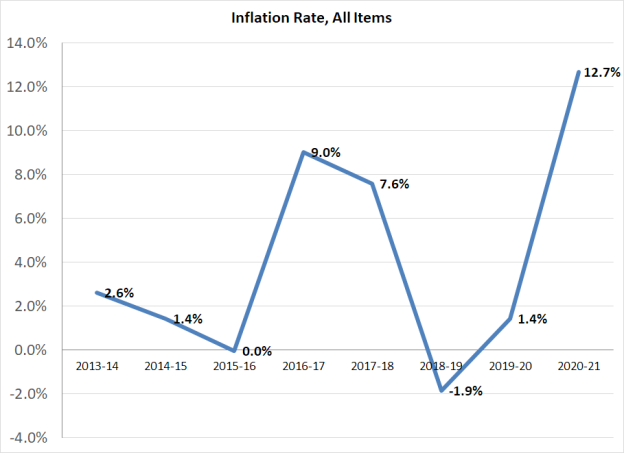
From 2020 to 2021, Eureka saw an overall inflation rate of 12.7%.
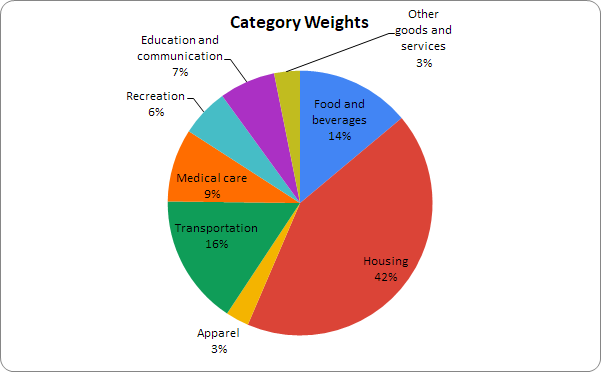
Notable sectors which saw heavy price increases were the housing category at 22.6% and other goods and services at 19.2%. Housing saw such a large increase in its overall inflation rate due to the spike in rents of primary residence. Rent for a 3 bedroom, 2 bathroom house saw an increase at the highest price from $2,150 in 2020 to $3,900 in 2021. The price of rent in 2020 was much lower for a two bedroom home, where the highest price listed in 2020 is $1,200, while the highest price this year is $1,495. Additionally, the prices of other categories are also up, such as the cost of renters insurance, which has increased by $20 a month. Other goods and services saw a general increase in prices across its subcategories, such as personal care products and personal care services. The medical care sector experienced an increase of 11%, primarily due to increased costs of prescription drugs. Lipitor increased by $178 between 2020 and 2021.
A large decrease of 19.4% occurred in the Transportation category, which makes up 16% of the consumer basket. This is primarily because of a decrease in the price of motor vehicle insurance. Rates dropped by about $40 to $50 for a 6-month premium, counteracting the slight increase in the price of gasoline. The price of an airplane ticket also decreased significantly, while bus fares stayed the same. Another category that experienced deflation is food and beverages. This category saw an overall decrease of 8.5%. This drop in prices was widespread with many individual goods seeing price declines between 2020 and 2021.
To better understand the impact on purchasing power, we also found wage data through the Bureau of Labor Statistics website and Craiglists ads. While the average inflation rate was 12.7%, the average annual salary increased by 5.5%, meaning that average real wage decreased by approximately 7.2%. We noticed that wages for almost all of the jobs in our data increased except for teachers, which saw an overall decrease.
Overall, the price increase for Eureka was unusual, as we saw the largest percentage of inflation since this project began in 2013. There were relatively large changes in most market baskets, especially in housing and medical, which are extremely volatile markets especially given the current pandemic circumstances. Though there were a few categories that experienced some level of deflation, like transportation and food and beverage, the scales of inflation in the larger weighted markets had a stronger impact on the overall percentage. See graphs below.